Input data that was used for this simulation.
Version: T05Year: 2016
DOY: 299
Hour: 19
Latitude: -35.92
Longitude: 249.15
Radius: 1.13
Rigidity step: 0.01 GV
Number of directions simulated: 577
Optimization level: No optimization
Spectrum: Force field Usoskin JGR 2017
DST: -13 PDYN: 0.70 BY: 0.00 BZ: -4.10
W1: 0.76 W2: 0.45 W3: 1.15 W4: 0.82 W5: 0.88 W6: 2.20
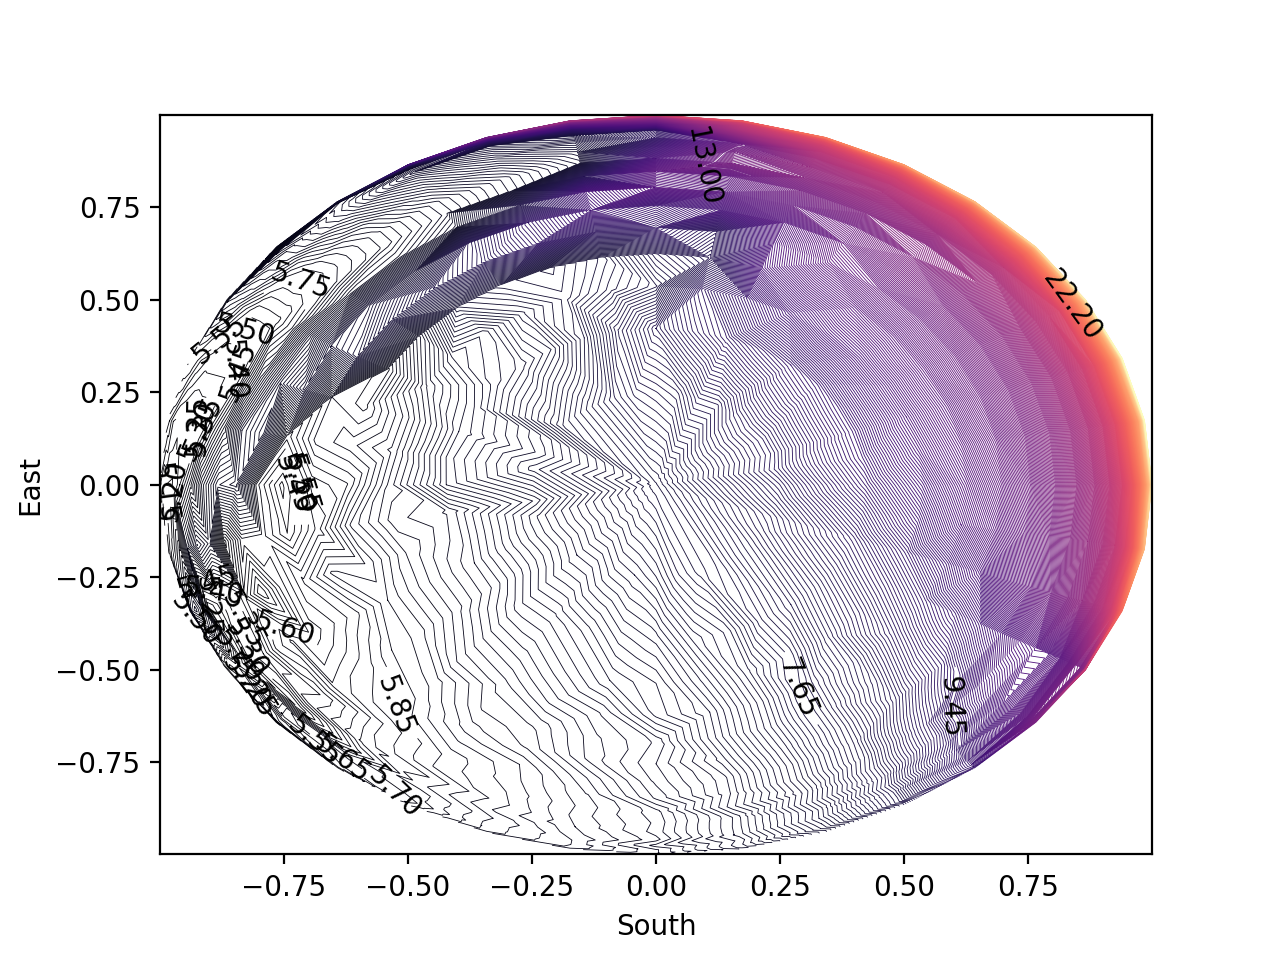
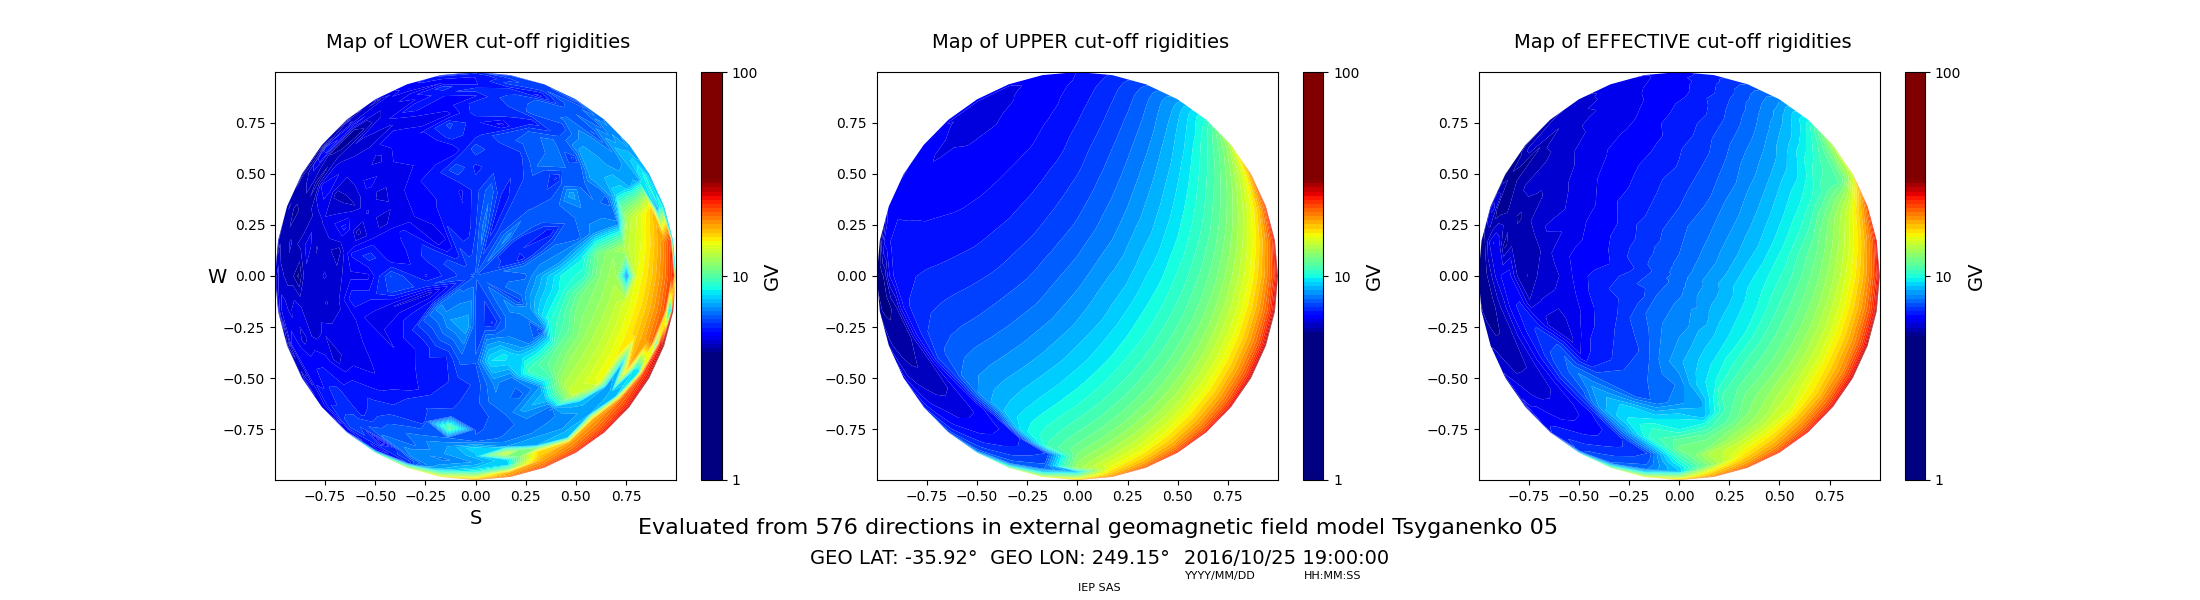
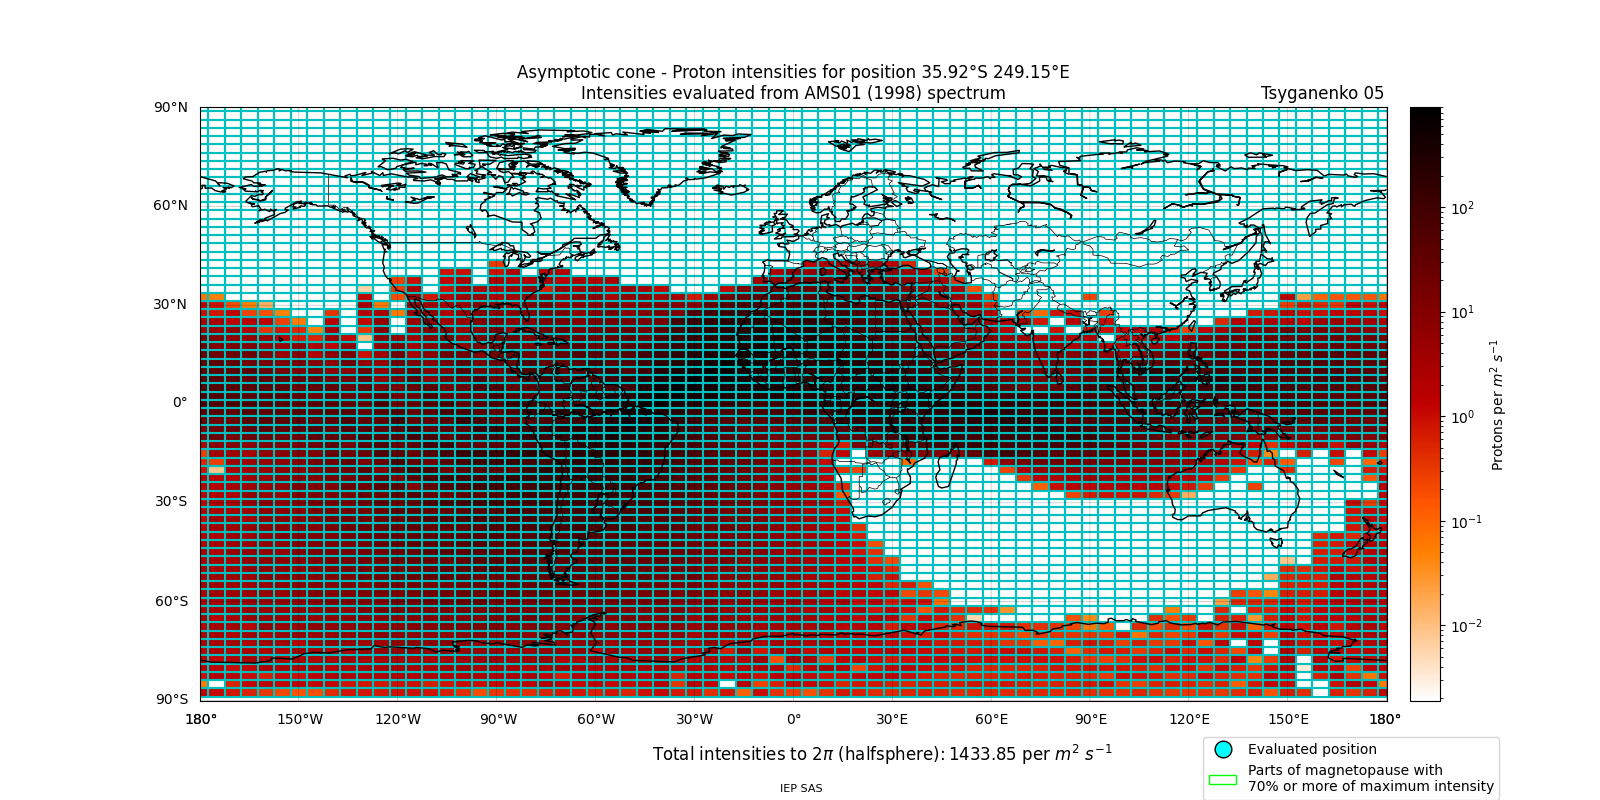
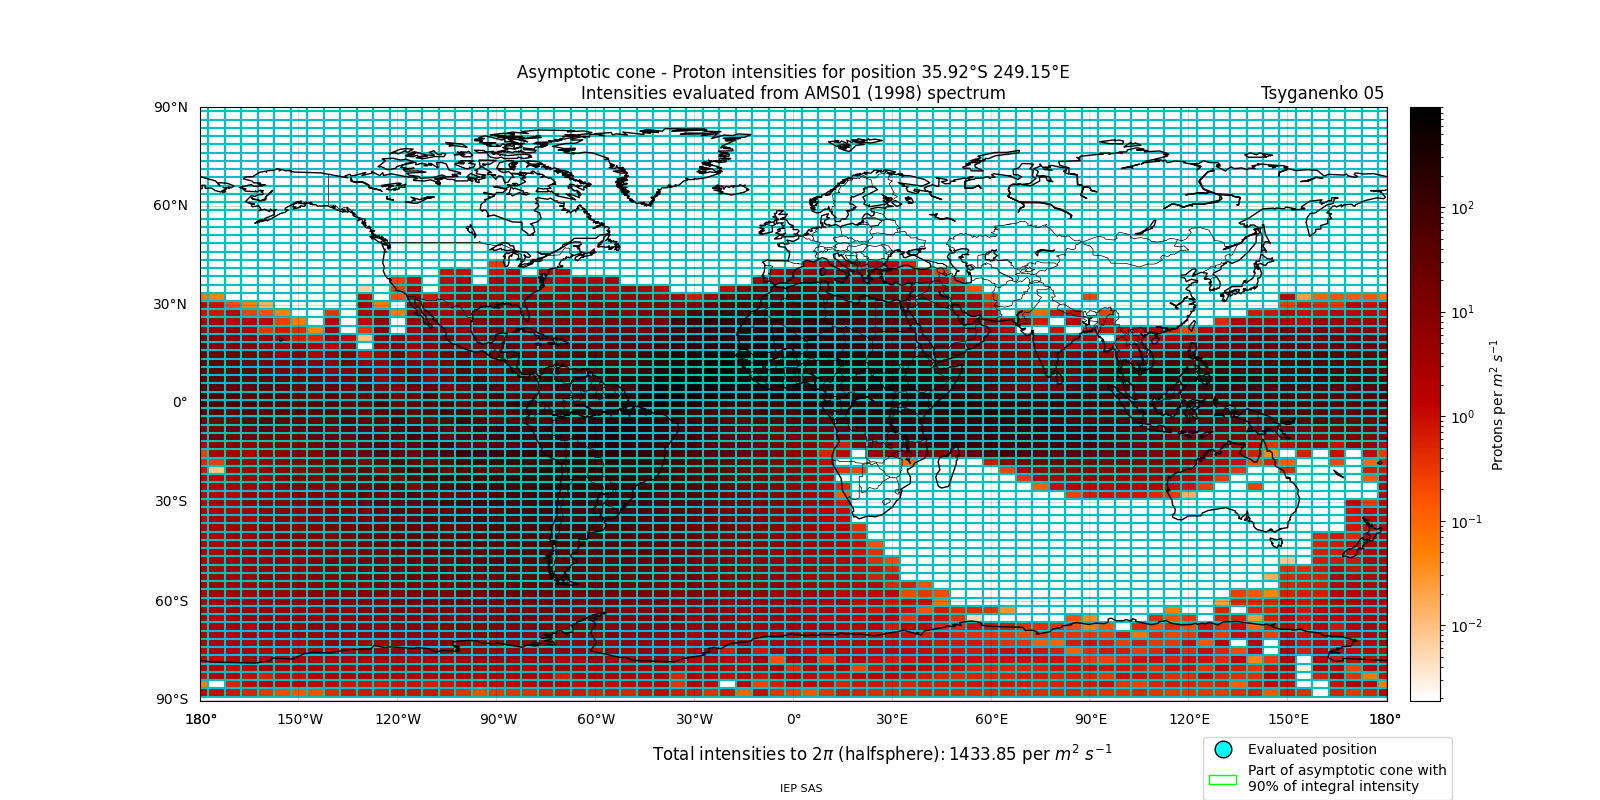
Effective cutoff rigidity sky map evaluated from 576 directions. Incoming directions cover a full half sphere.
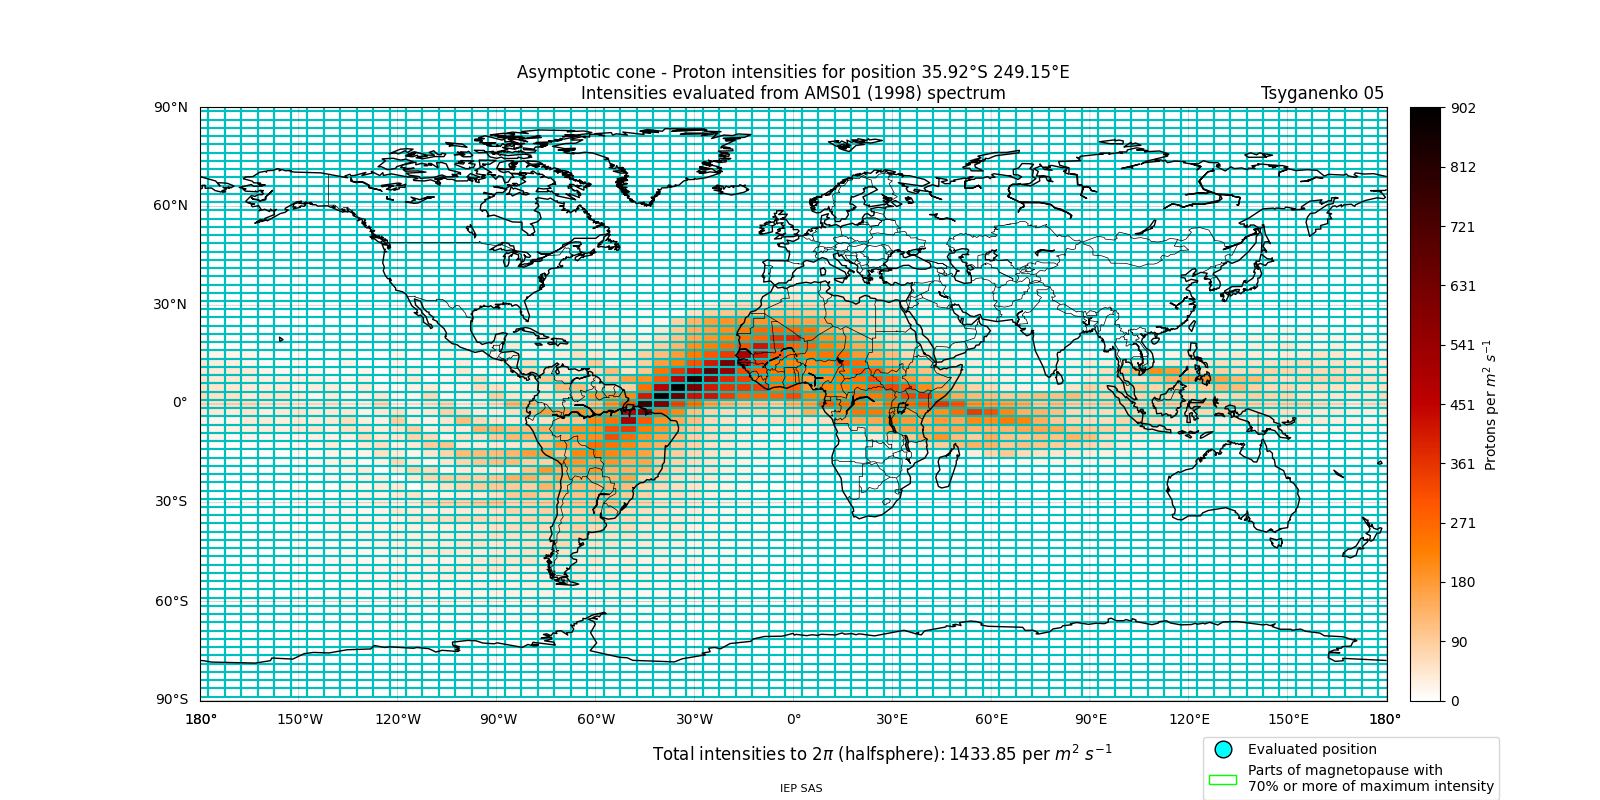
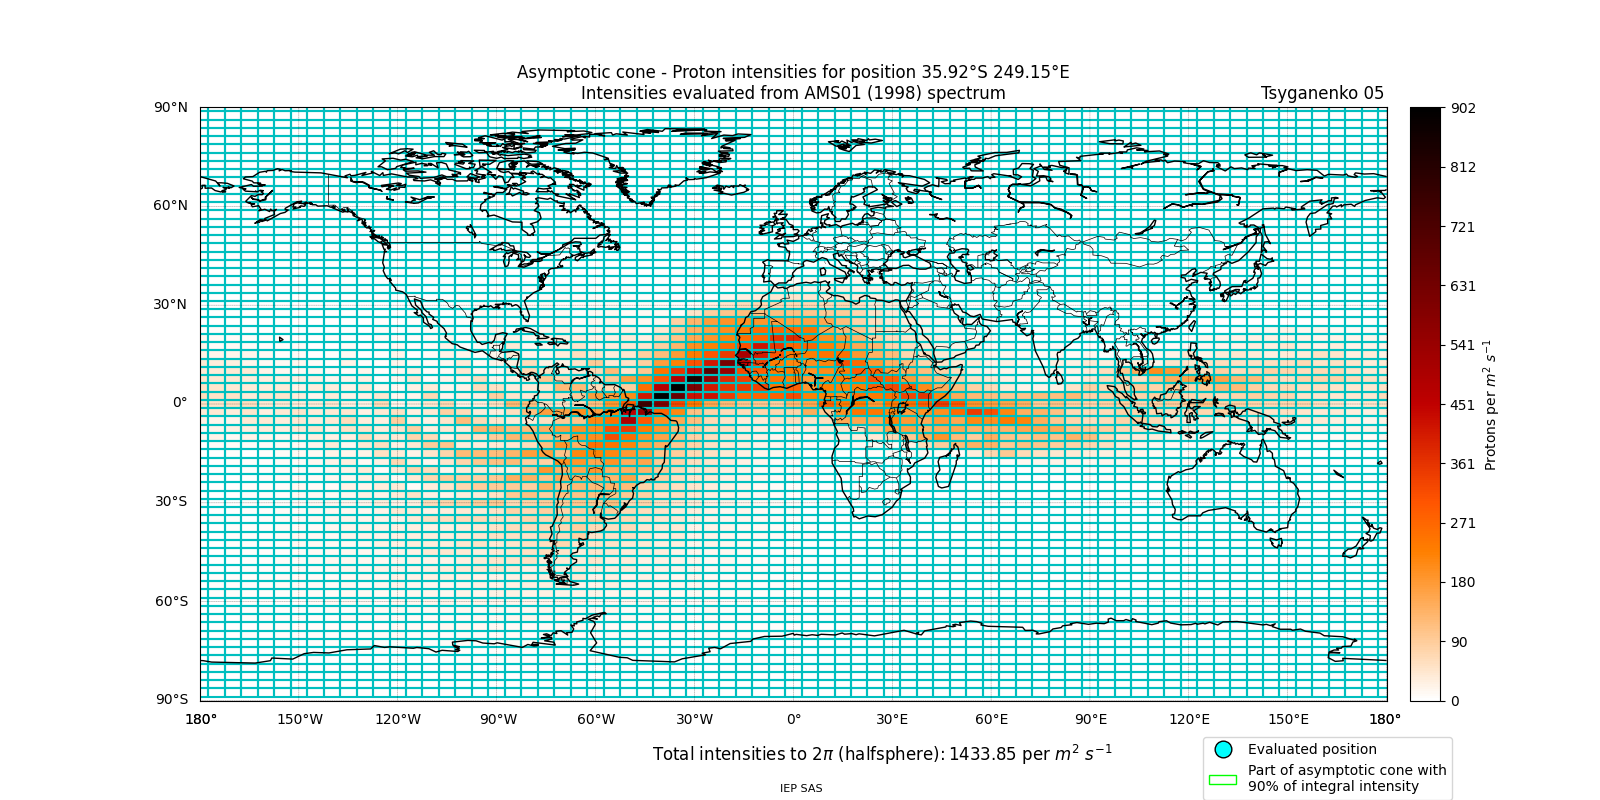
Full asymptotic cone where intensity of incoming particles from different asymptotic direction is indicated by colors representing a part of the total registered intensity in percents. As spectrum at 1AU was used AMS-01 spectrum from region 10 (most poleward region, where influence of magnetosphere to cosmic rays was smallest).
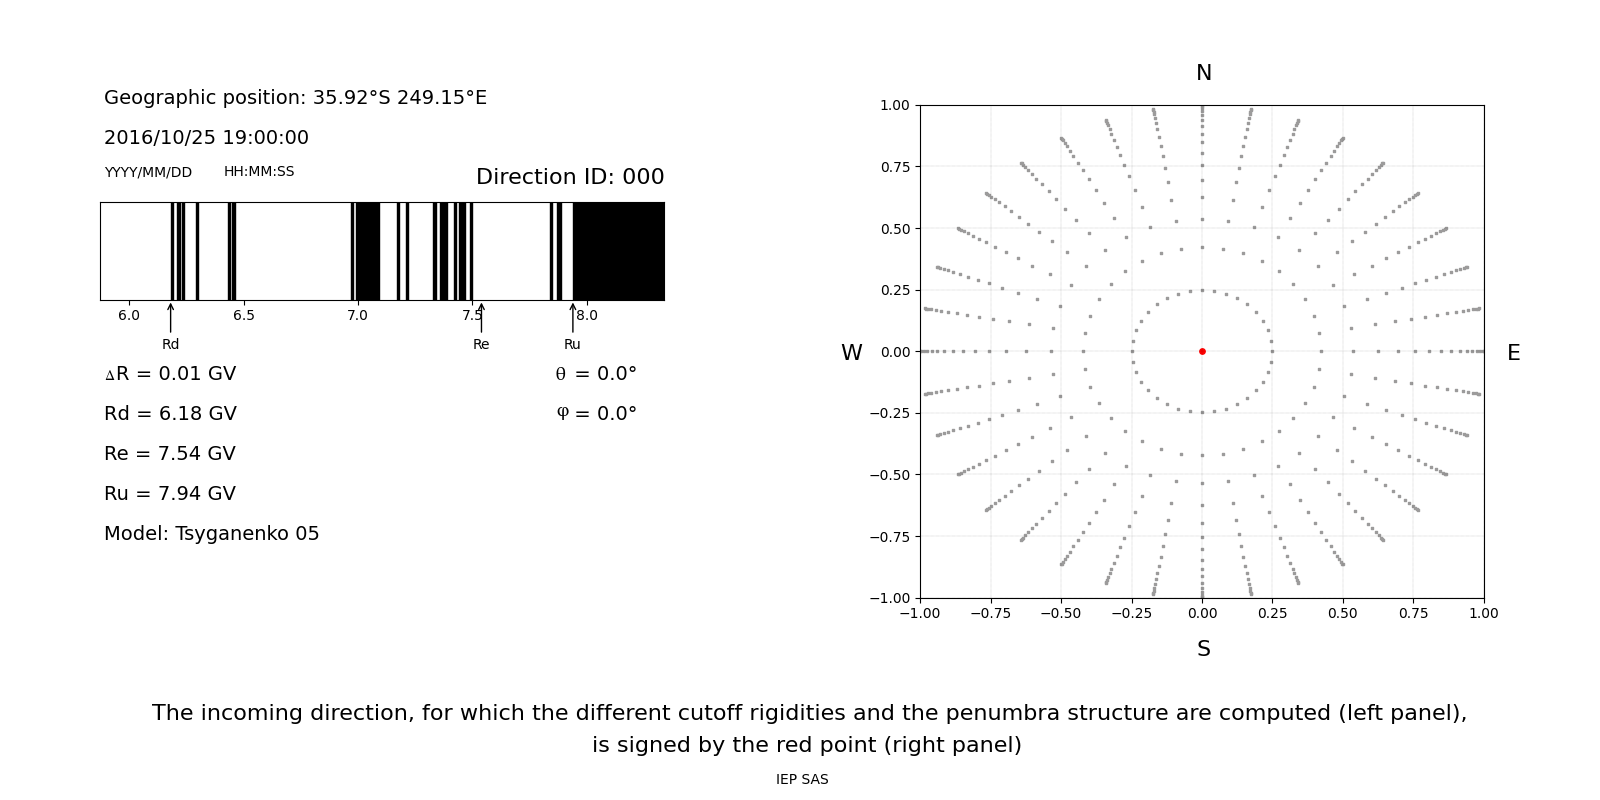
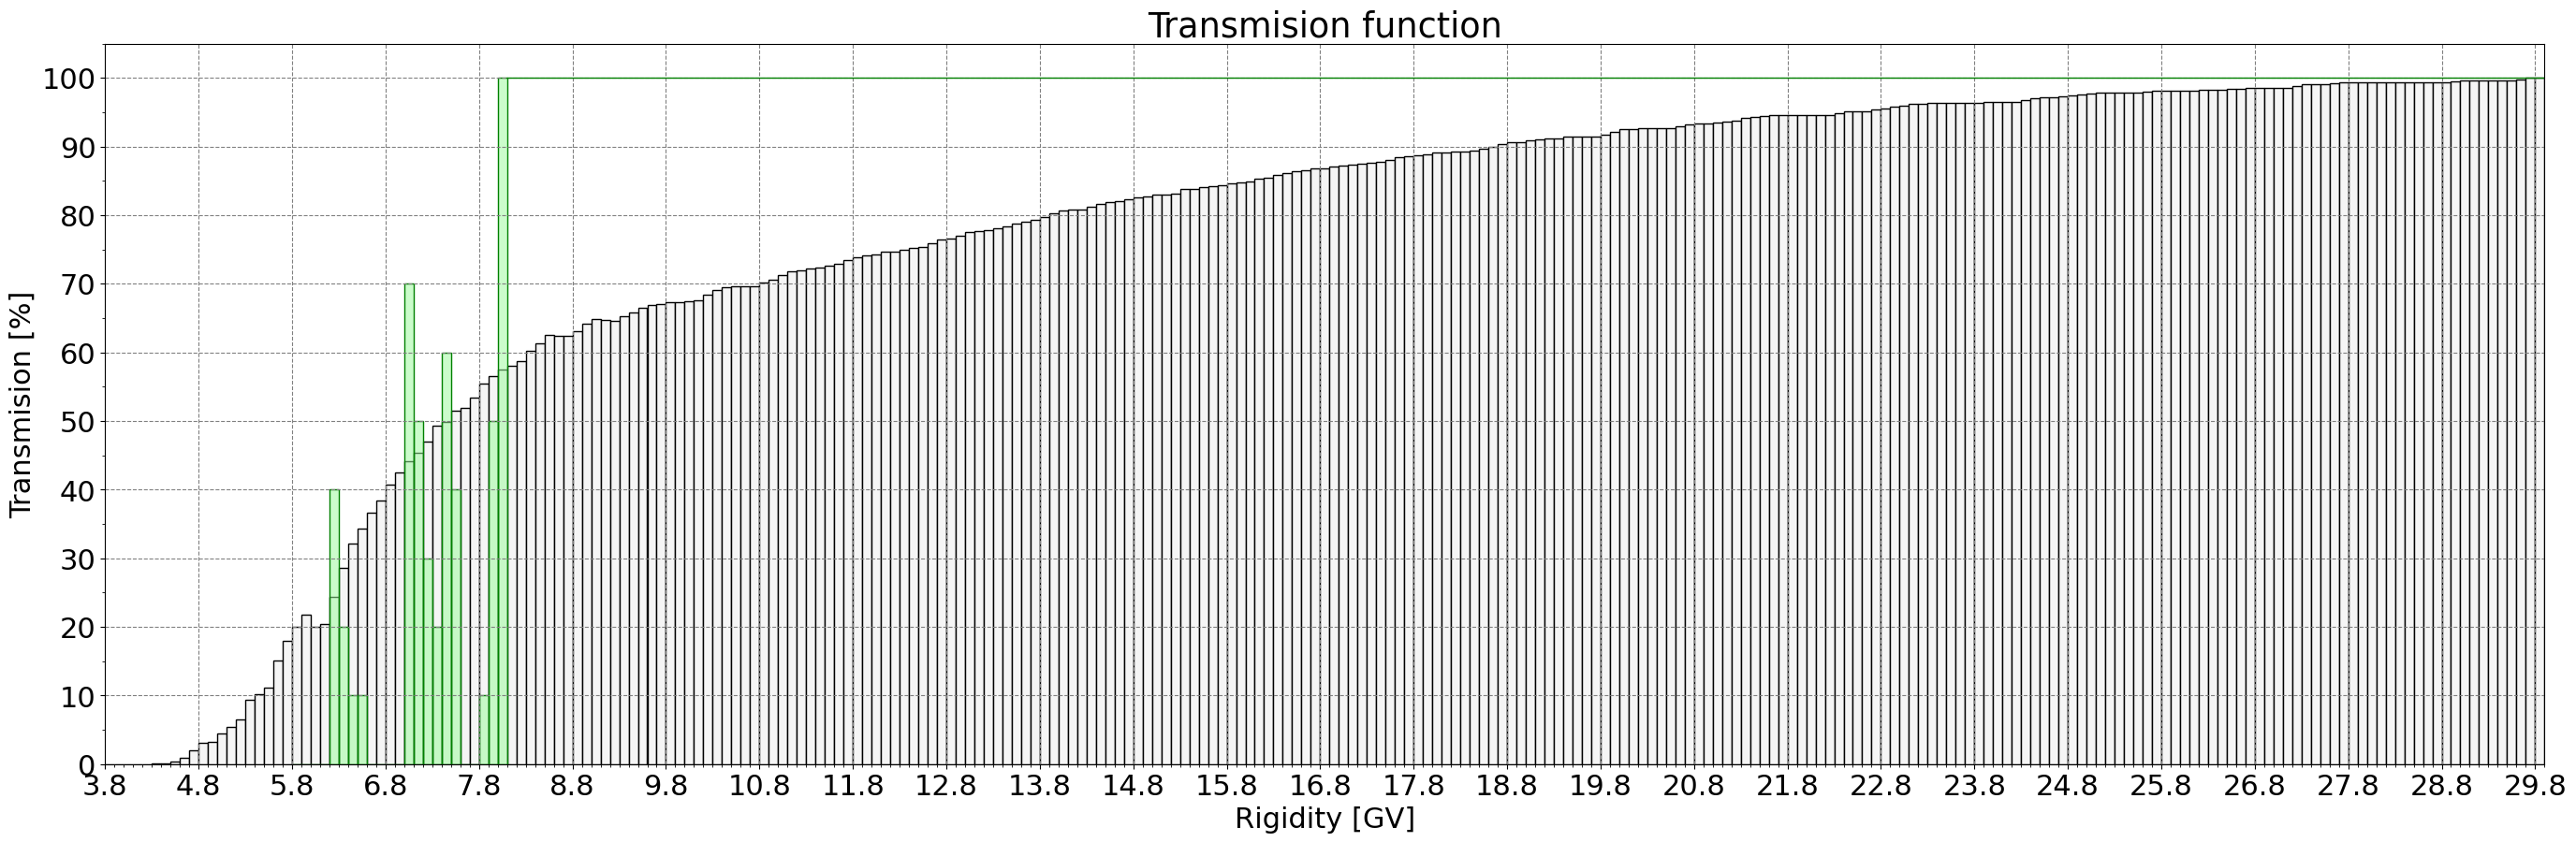
Transmission function, denoted by black line, shows probability of particles from all directions with rigidity R to reach selected point inside magnetosphere. Green histogram displays transmission function for vertical incoming trajectories.
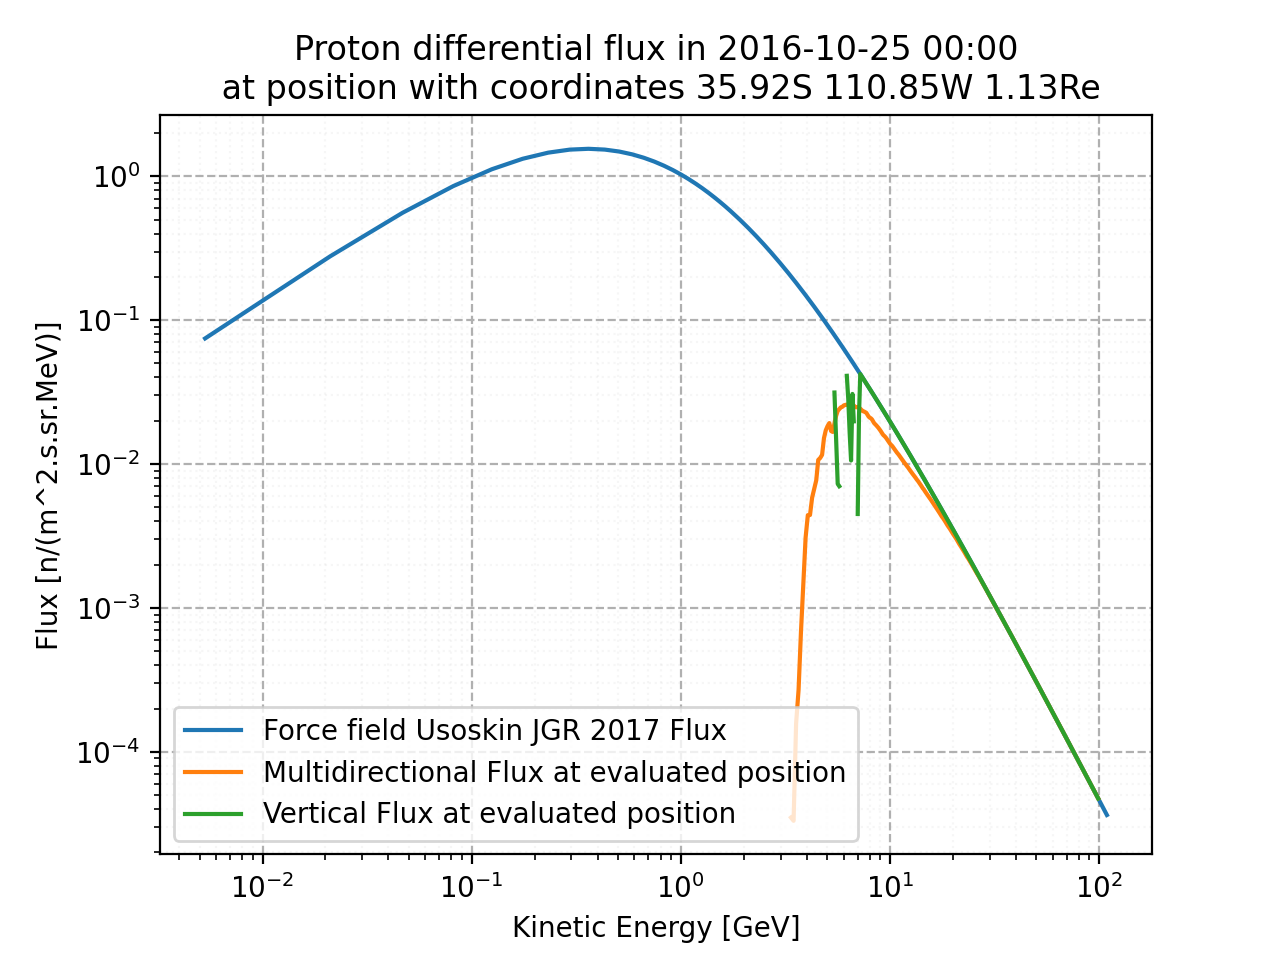
Differential flux at the top of the atmosphere from vertically incoming trajectories (denoted by green color) and from multidirectional simulation(denoted by orange color). Spectrum ať the magnetopause is denoted by blue color.
Input data that was used for this simulation.
Version: T05Year: 2016
DOY: 299
Hour: 19
Latitude: -35.92
Longitude: 249.15
Radius: 1.13
Rigidity step: 0.01 GV
Number of directions simulated: 577
Optimization level: No optimization
Spectrum: Force field Usoskin JGR 2017
DST: -13 PDYN: 0.70 BY: 0.00 BZ: -4.10
W1: 0.76 W2: 0.45 W3: 1.15 W4: 0.82 W5: 0.88 W6: 2.20
Effective cutoff rigidity sky map evaluated from 576 directions. Incoming directions cover a full half sphere.
Full asymptotic cone where intensity of incoming particles from different asymptotic direction is indicated by colors representing a part of the total registered intensity in percents. As spectrum at 1AU was used AMS-01 spectrum from region 10 (most poleward region, where influence of magnetosphere to cosmic rays was smallest).
Transmission function, denoted by black line, shows probability of particles from all directions with rigidity R to reach selected point inside magnetosphere. Green histogram displays transmission function for vertical incoming trajectories.
Differential flux at the top of the atmosphere from vertically incoming trajectories (denoted by green color) and from multidirectional simulation(denoted by orange color). Spectrum ať the magnetopause is denoted by blue color.
Be aware that on Windows you need to use software called 7-Zip to open .tar.bz2 archive. Be sure to use the newest version. 7-Zip version 19 contained a bug that would cause a failure when attempting to open tar.bz2 archives. We recommend using version 7-Zip 23.01.